Gdoc/Admin

Popular pages

Research and data to make progress against the world’s largest problems.

13,172 charts across 123 topicsAll free: open access and open source

Our Mission

What do we need to know to make the world a better place?

To make progress against the pressing problems the world faces, we need to be informed by the best research and data.

Our World in Data makes this knowledge accessible and understandable, to empower those working to build a better world.

Read about our mission

We are a non-profit — all our work is free to use and open source. Consider supporting us if you find our work valuable.

Donate to support us
As seen on
Logos of the publications that have used our content. From left to right: Science, Nature, PNAS, BBC, Financial Times, The New York Times, The Guardian, The Atlantic, and The Washington Post

Daily Data Insights

Bite-sized insights on how the world is changing, published every weekday.

See all Daily Data Insights
A horizontal bar chart titled "People in many countries are pessimistic about housing, 2024" shows the responses from various countries regarding perceptions about their housing situation. Each bar represents the percentage of responses categorized as: "Wrong Track" (indicated by dark red), "Don't Know" (light green), and "Right Track" (purple). 

Countries listed from top to bottom include: Netherlands, Spain, Hungary, Germany, Turkey, Great Britain, France, Ireland, Italy, Belgium, Sweden, and Poland. The chart reveals a dominant trend of pessimism, with many countries showing a higher percentage in the "Wrong Track" category. 

The data source is OECD (2025), and the note specifies that the survey question asked was: "In general, do you think that your country is on the right track or the wrong track when it comes to housing?"

Many Europeans say their nations are on the wrong track with housing

The Ipsos Housing Monitor 2025 surveyed people across 30 countries, asking: “In general, do you think that your country is on the right track or the wrong track when it comes to housing?”.

The chart shows results for European countries, where housing prices have risen sharply since the global financial crisis, with particularly large increases since 2015.

The Netherlands and Spain stand out, with nearly 80% believing their country is on the wrong track.

People in Poland and Sweden are less concerned than in other countries. But even in these nations, the majority feels like their country is on the wrong track.

Explore more data on optimism and pessimism about the future

Continue reading
This chart shows the share of women who have had no births by the end of their childbearing years in four countries: the United States, Sweden, Japan, and Spain. 

Each country's data is represented on separate graphs, plotted against the years from 1918 to 1972 along the horizontal axis, labeled as "Women's birth year." The vertical axis indicates the percentage of women who have had no births, ranging from 0% to 30%. 

In the United States graph, the percentage starts around 15% in 1918, dips slightly mid-century, and then rises again to near 20% by the early 1970s. 

The Sweden graph shows a relatively stable line around 10–15% throughout the years, with no significant fluctuations.

Japan's graph trends upward, reaching around 25% by the end of the timeline.

In Spain, the share steadily increases, culminating in over 20% by 1972, indicating a growing trend in women having no births.

The data source is cited as the "Human Fertility Database (2024)." The chart is published by Our World in Data.

What share of women reach the end of their childbearing years without having children?

This chart focuses on the share of women who had no births by the end of their childbearing years. The horizontal axis shows the woman’s birth year.

Around 18% of those born in the 1910s in the United States had no children. For the following generations who grew up during the “baby boom”, the share with no children dropped to 5%. Since then, this figure has risen and fallen again.

In Sweden, the share of women without any children has remained relatively stable at around 12% for women born between the 1950s and 1970s.

The trend in Japan and Spain has been different: the share of women with no children has grown steeply over recent generations. In Spain, the figure nearly doubled in a decade: from 10% for women born in 1960 to almost 20% for those born in 1970. In Japan, it almost tripled in twenty years.

Explore this data for twenty more countries

Continue reading
The bar chart illustrates changes in household composition in the United States from 1960 to 2015. The chart consists of three horizontal bars, each representing a different year: 1960, 1990, and 2015. 

In 1960, the largest segment is "Couple with children," which accounts for 43%. Other segments include: "Single parent with children" at 5%, "Couple" at 22%, "Extended family" at 12%, "Non-relatives" at 4%, and "One person" at 13%.

By 1990, the "Couple with children" category has decreased to 30%. The breakdown is: "Single parent with children" at 8%, "Couple" at 24%, "Extended family" at 8%, "Non-relatives" at 5%, and "One person" at 25%.

In 2015, "Couple with children" drops further to 24%, with the segments now being: "Single parent with children" at 9%, "Couple" at 25%, "Extended family" at 9%, "Non-relatives" at 5%, and "One person" increasing to 28%.

Data sources for the chart are cited as United Nations, 2022.

Solo living has become the most common arrangement for households in the United States

Households in the United States have changed significantly over the last 60 years. In 1960, 43% of households were couples with children, but this had dropped to 24% by 2015.

Once a minority, single individuals living alone are now the most common composition, making up 28% of households in 2015.

Several factors may explain this shift. Since 2000, most population growth has occurred among those over 60, who are more likely to live alone after widowhood or once children leave home. Declining birth rates have further reduced the share of households with children.

At the same time, rising incomes among women, in particular, have made independent living more accessible, likely contributing to the increase in single-person households alongside the trend of marrying later or not at all.

Explore how household types compare across different countries

Continue reading
The chart titled "Women live longer than men in every country" shows a scatter plot of life expectancy for men and women in 2023, categorized by continent. Each dot represents a country, with its color indicating the continent: Africa, Asia, Europe, North America, Oceania, or South America. The x-axis displays life expectancy for men, while the y-axis shows life expectancy for women. A diagonal line indicates where life expectancy for both genders would be equal. All dots are above this line, meaning women have a higher life expectancy than men in every country. The trend shows increasing life expectancy for both genders, with women consistently living longer. Data source: UN World Population Prospects (2024).

Women live longer than men in every country in the world

In every country in the world, women tend to live longer than men.

You can see this in the chart below, which shows the average life expectancy of women on the vertical axis and the life expectancy of men on the horizontal axis, both for 2023. Each dot is one country.

As you can see, all countries lie above the middle line, which means that women's life expectancy was higher than men's.

There are various reasons why this gap in life expectancy exists, which my colleagues Saloni Dattani and Lucas Rodés-Guirao explain in their article. Typically, births are skewed in favor of males, with around 105 boys being born for every 100 girls. However, throughout childhood, adolescence, and adulthood, mortality rates tend to be higher in males.

This data comes from the United Nations’ World Population Prospects.

Read our article on why women live longer than men →

Continue reading
A bar chart illustrating the reliance of nine African economies on oil rents as a percentage of GDP for the year 2021. The chart includes the following countries listed from highest to lowest percentage: Libya at 56%, Congo at 34%, Angola at 28%, Chad at 17%, Gabon at 16%, Equatorial Guinea at 15%, Algeria at 14%, Nigeria at 6.2%, and Ghana at 4.1%. A note highlights that oil rents account for over half of Libya's GDP. The source of the data is the World Bank, 2024. The chart features colored bars representing each country's oil rent percentage, along with the flags of the respective countries next to their names.

Many African countries are heavily dependent on oil production

Oil production plays an important role in the economy of many African countries. The chart shows oil rents as a percentage of gross domestic product (GDP) for the nine African nations most reliant on it.

Libya ranks first, with oil rents equivalent to 56% of its GDP in 2021, followed by Congo at 34% and Angola at 28%. Despite being Africa’s largest oil producer, Nigeria’s oil rents are just 6.2% of its GDP.

Despite this, these countries’ oil production is relatively modest on a global scale. In 2021, their combined output was less than half of what the United States, the world’s top producer, extracted.

Explore oil production for more countries

Continue reading
A graph titled "Internet usage has surged in Asia's four most populous countries" shows the percentage of the population that used the Internet in the last three months across four countries: China, India, Indonesia, and Pakistan. 

- In China, the percentage increased from 2% in 2000 to 77% in 2023, with a steadily rising line.
- India shows a rise from 1% in 2000 to 43% in 2023, with a gradual upward trend.
- Indonesia's internet usage jumped from 1% in 2000 to 69% in 2023, following a similar growth pattern.
- Pakistan also increased its usage from 1% in 2000 to 33% in 2023, showcasing an upward trend.

At the bottom, there is a note indicating the data source is the International Telecommunication Union via the World Bank, along with additional information that India's latest data is from 2020 and Pakistan's is from 2022. The graphic has a Creative Commons BY attribution.

Internet use has grown rapidly but unevenly across Asia's largest countries

Since the turn of the millennium, Internet access has grown quickly but at different rates across Asia’s most populous nations.

Four countries, home to more than 40% of the world's population, tell this story in the chart: China, India, Indonesia, and Pakistan.

Internet users in China rose from 2% in 2000 to 77% in 2023, while Indonesia’s users grew from 1% to 69%. The pace has been slower in South Asia, with India reaching 43% by 2020 and Pakistan 33% by 2022.

Explore Internet usage for more countries

Continue reading
A global map shows the share of mothers aged 20–44 who have lost a child under five years old. The data is categorized into four ranges: less than 1% (light yellow), 1% to 5% (yellow), 5% to 10% (orange), 10% to 30% (dark orange), and more than 30% (red). Higher rates are concentrated in Sub-Saharan Africa and parts of South Asia, while lower rates are seen in North America, Europe, and parts of East Asia. Data is sourced from Smith-Greenaway et al. (2021) and reflects single-year estimates between 2010 and 2018.

In some countries, more than one in three mothers have lost a child younger than five

There are few experiences, if any, that are more painful for a parent than losing a child.

In the past, child deaths were much more common than they are today. But even when these deaths were not unusual, historical diary entries show us that most parents still found them heartbreaking.

Unfortunately, in many countries today, a large share of parents still experience the loss of a child. The map here shows the share of mothers who lost a child before they reached the age of five.

In most of Europe and North America, this share is less than 1%. But in some of the world’s poorest countries — like Cameroon, Nigeria, and the Central African Republic — more than one in three mothers have experienced this tragedy.

These figures come from a research article by Emily Smith-Greenaway and colleagues, based on reported or estimated data from 2010 to 2018 for mothers aged 20 to 44.

Read my colleague Max Roser’s article for more historical context around this data →

Continue reading

Get Daily Data Insights delivered to your inbox

Receive an email from us when we publish a Daily Data Insight (every weekday).

By subscribing you are agreeing to the terms of our privacy policy.

Explore our data

Featured data from our collection of 13,172 interactive charts.

See all our data

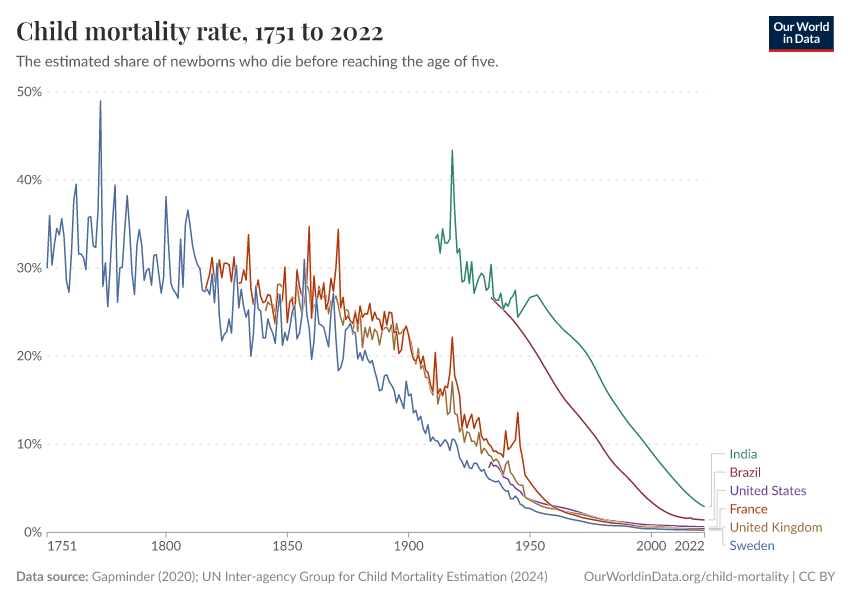
What share of children die before their fifth birthday?

What could be more tragic than the death of a young child? Child mortality, the death of children under the age of five, is still extremely common in our world today.

The historical data makes clear that it doesn’t have to be this way: it is possible for societies to protect their children and reduce child mortality to very low rates. For child mortality to reach low levels, many things have to go right at the same time: good healthcare, good nutrition, clean water and sanitation, maternal health, and high living standards. We can, therefore, think of child mortality as a proxy indicator of a country’s living conditions.

The chart shows our long-run data on child mortality, which allows you to see how child mortality has changed in countries around the world.
Explore and learn more about this data

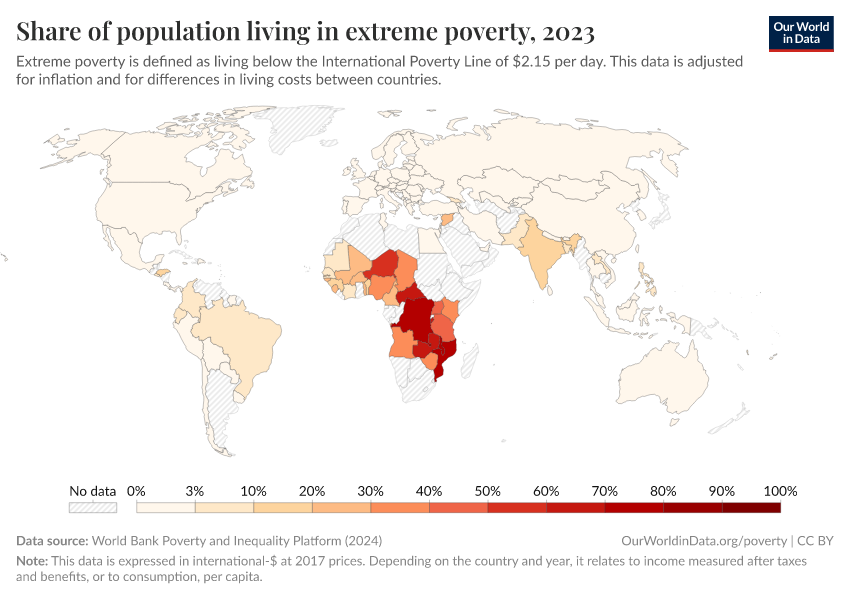
Share of population living in extreme povertyWorld Bank

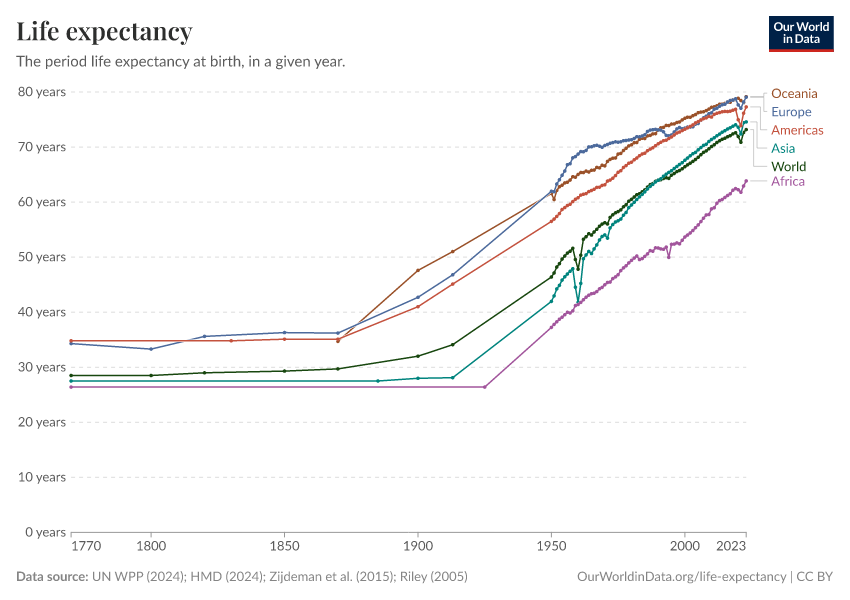
Life expectancy at birthLong-run estimates collated from multiple sources by Our World in Data

Per capita CO₂ emissionsLong-run estimates from the Global Carbon Budget

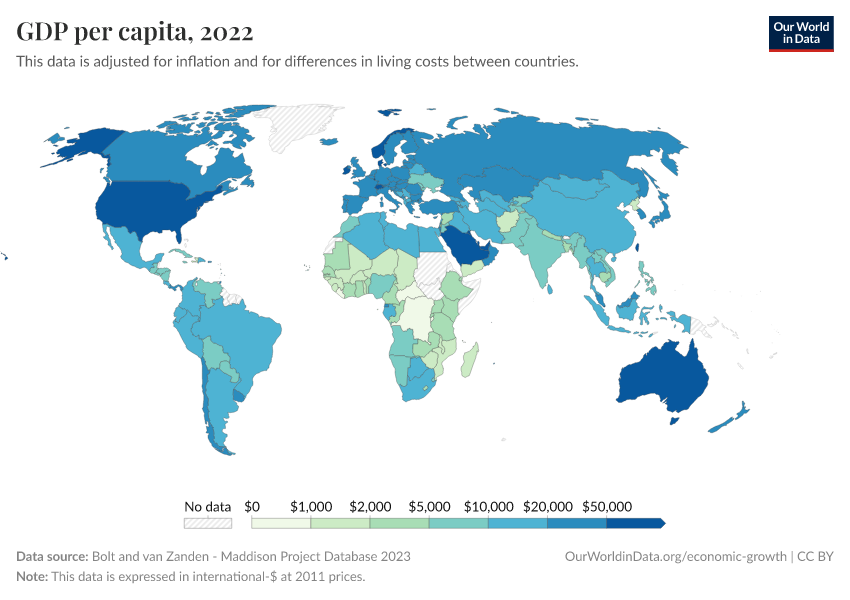
GDP per capitaLong-run estimates from the Maddison Project Database

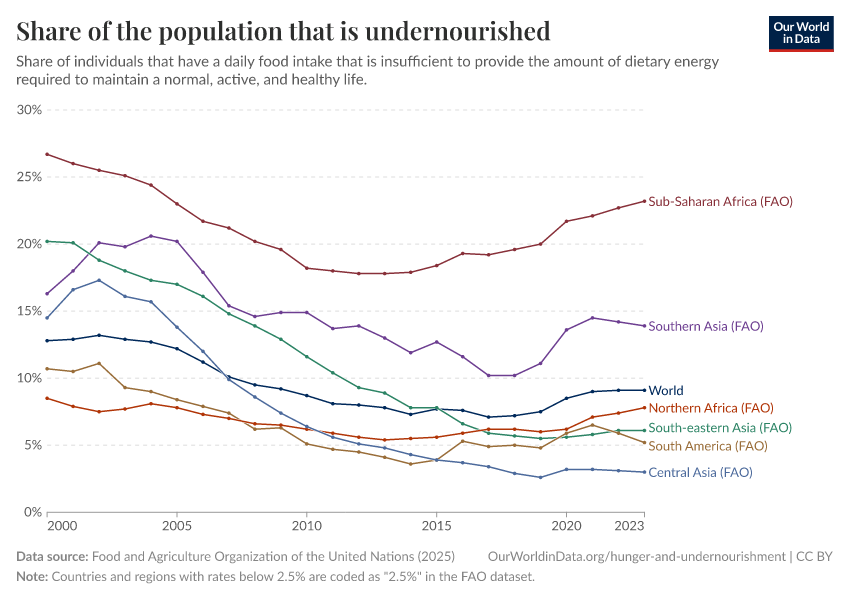
Share of people that are undernourishedFAO

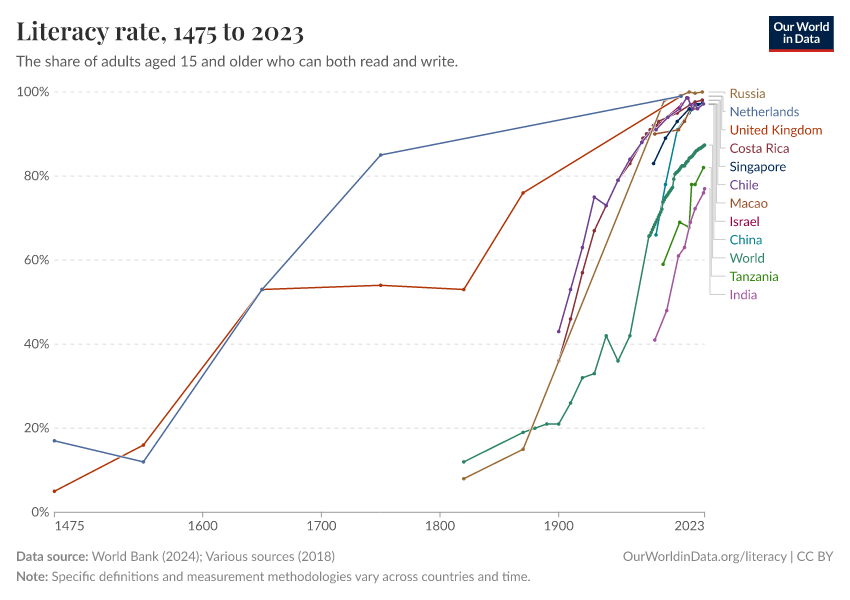
Literacy rateLong-run estimates collated from multiple sources by Our World in Data

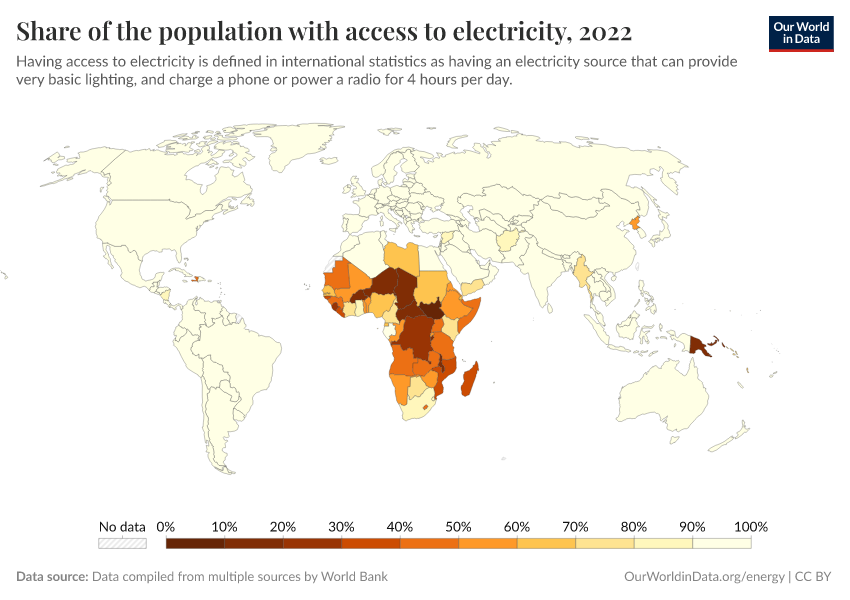
Share of the population with access to electricityWorld Bank

Data explorers

See all our Data Explorers

Interactive visualization tools to explore a wide range of related indicators.

Subscribe to our newsletters

Receive our latest work by email.
By subscribing you are agreeing to the terms of our privacy policy.

All our topics

All our data, research, and writing — topic by topic.

Population and Demographic Change

Health

Energy and Environment

Food and Agriculture

Poverty and Economic Development

Education and Knowledge

Innovation and Technological Change

Living Conditions, Community and Wellbeing

Human Rights and Democracy

Violence and War